Week 11: Network Analysis
I understand a bit about network analysis from another class where we have been introduced to RDF modeling, from which you can create network graphs showing relationships among entities. The entities are called nodes on the graph and the lines are referred to as edges. Beyond that, this topic is very new to me. It is also easy to get lost in the weeds of the mathematical thinking that goes into network analysis. But humanists should tread warily if they are using network analysis tools without understanding the math behind them.
With network analysis, you can test the nodes on the graph for different types of centrality:
- Degree looks at how many edges connect to the node.
- Betweenness looks at how many hops it takes to get from one node to another. The node that you hop through the most often is the node with the most betweenness.
- Stress is similar to betweenness, but looks at how you hop from one node to another if you remove a node.
- Eigen-vector looks at the thickness of the line connecting nodes and is a measure of influence. Google’s PageRank algorithm is a variation of Eigen-vector centrality.
I have some experience from my legal career from electronic discovery vendors selling network analysis products as a method of reviewing company emails for litigation. I was not impressed at the time, although the technology may have improved in the interim. The issue was that the network analysis took a lot of effort and did not reveal anything that alternative and cheaper methods did not already reveal. The number of emails exchanged between two people turns out not to be a good representation of their level of communication or at least not a good representation of their communication of misconduct. Keywords or names with keywords worked better, but names alone did not. As a result of this prior history, I was and perhaps still am somewhat skeptical of what network analysis might reveal. Moreover, as Scott Weingart noted here
If humanists care more about the differences than the regularities, more about what makes an object unique rather than what makes it similar, that is the very information they are likely to lose by defining their objects as nodes.
In other words, the fringes of the network might be more interesting than the center of the network.
Technology for network analysis also raises again the question of the purpose of digital humanities tools. They can be useful for discovery – finding odd bits of data that demand explanation that is then pursued through traditional methods. It is still an open question question whether they contribute to new results or merely add quantification to previously qualitative analysis.
Using Palladio
I followed the tutorial from Programming Historian and looked at the Palladio documentation as well.
I used the sample data set provided by Palladio, which did not produce what I expected. The network graph sorted by profession (artist, aristocrat, etc.) rather than showing the relationships among the people in the data. This data would be better presented by a bar chart. I tried other dimensions as well such as birthplace and place of death, but the network graph did not indicate the direction of relationship (from birth to death), so there was no way to tell whether the node for a place was prominent as a frequent birthplace or place of death or both.
I switched to the data set provided by Programming Historian and got more of what I expected a network diagram to reveal:
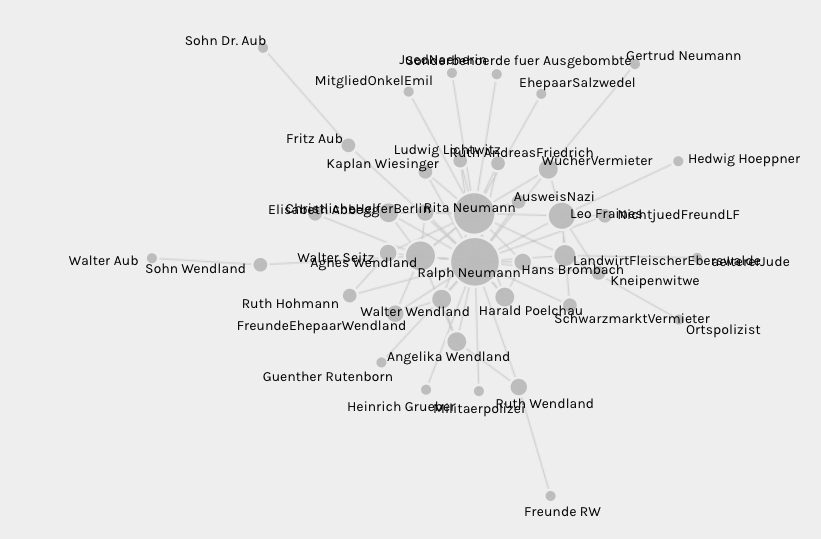
The process of creating the data set to use in Palladio required close reading of the source material. The distant reading created by the Palladio analysis may or may not have added to the research in the end. Nonetheless, the coding of the raw material no doubt helped the researcher think critically about how to categorize the data and highlight those interesting or contrarian data points that Weingart noted.